Create a blank presentation from scratch

In this article we will show you how you can create a presentation in PowerPoint from scratch. You will learn how to add slides, change the layout, add text and tables. What are you waiting for? Read on…
Adding slides
Once you have a blank presentation you need to add slides and content.
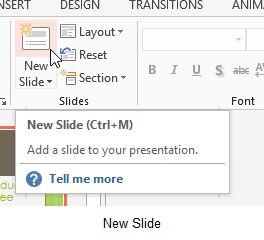
- From the Home Ribbon Click on New Slide or Press Control + M on the keyboard
- A new standard slide will be added.
Figure 37- Add slides
Add a slide using the right mouse button by right clicking in the navigation pane and selecting New Slide.
Figure 38- use the right mouse to add a slide
Change the layout of a slide
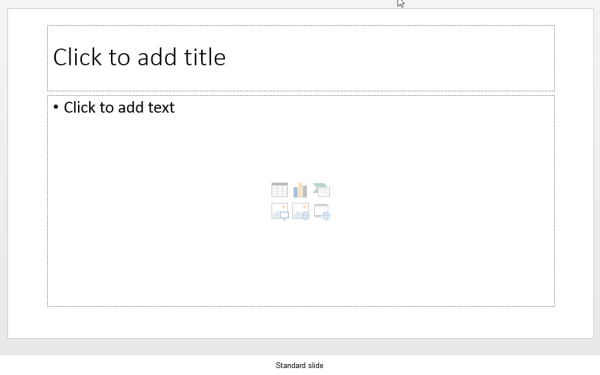
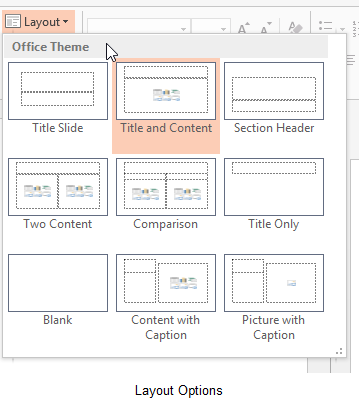
PowerPoint always adds a slide that has the same layout as the previous slide. You can change the layout from the Layout Icon on the Home Ribbon.
Standard slide
Figure 39- Standard slide layout
Layout options
Figure 40- choose from the layout options on offer
Change the layout depending on what you want to achieve. Choose from:
- Title and Content
- Section Header
- Two Content
- Comparison
- Title Only
- Blank
- Content with Caption
- Picture with Caption
Adding text
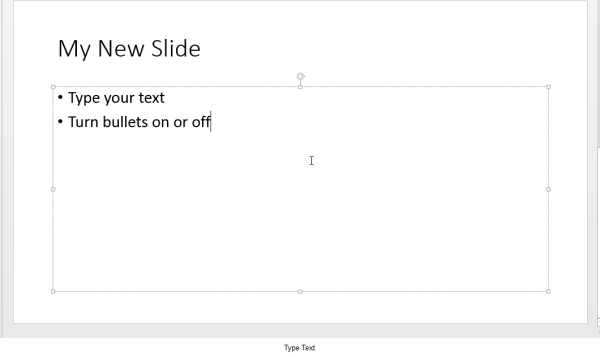
Click into the placeholder where you want to add text and type. Heading text will be formatted in a larger font than the bulleted list as you want the headings to stand out.
The standard placeholder will offer you a bulleted list – you can turn on or turn off bullets just like in Word.
Figure 41- click and type to add text
The standard slide layout offers you six choices for adding content.
Figure 42- standard layout choices
- Tables
- Charts
- Smart Art
- Pictures
- Online Pictures
- Media – movies and sounds
To add one of the content types click on the icon and you will be guided through.
We will take a brief look at adding each type of content now and then focus in more depth on each content type later on in this book.
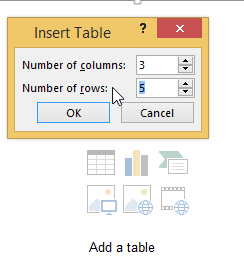
Adding a table
- Click on the Table Icon
- Select the number of columns and rows
Figure 43- add a table
- Click OK
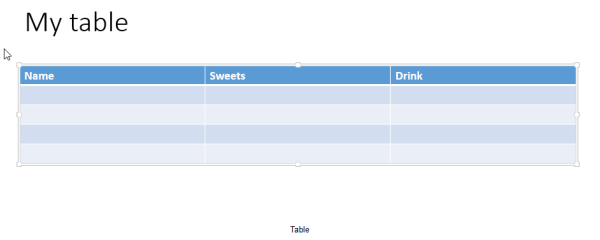
Now you can simply fill in the table. Use the Tab key to move between cells and when you get to the end tab again to get a new row.
Figure 44- a formatted table is added
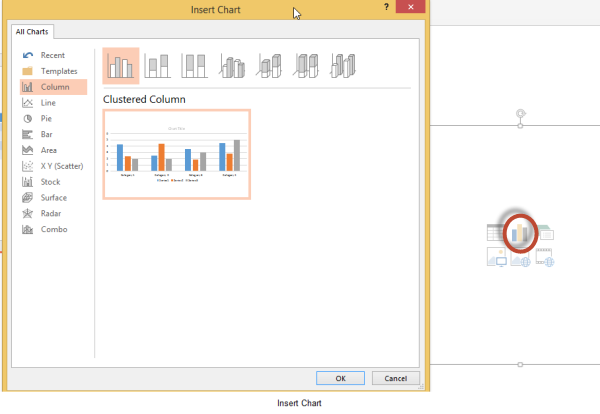
Adding a chart
- Click the Chart Icon to add a chart
Figure 45- add a chart
- Select the type of chart you want to add – I have selected a column chart
- Click OK
#
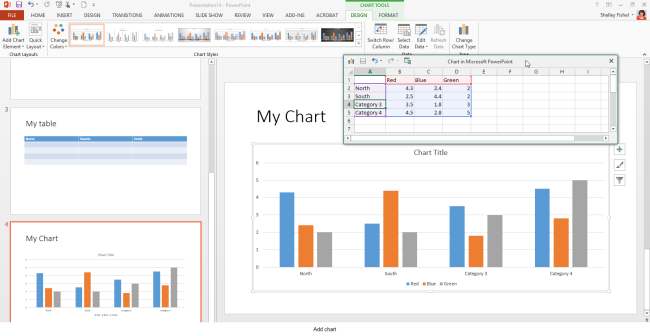
Figure 46 – create the chart
You now have a mini spreadsheet ready for you to populate with your own data. Simply change the sample headings and data and the chart will update.
Close the mini spreadsheet and you are left with the chart in the slide.
We will look at charts in more detail later in the book.
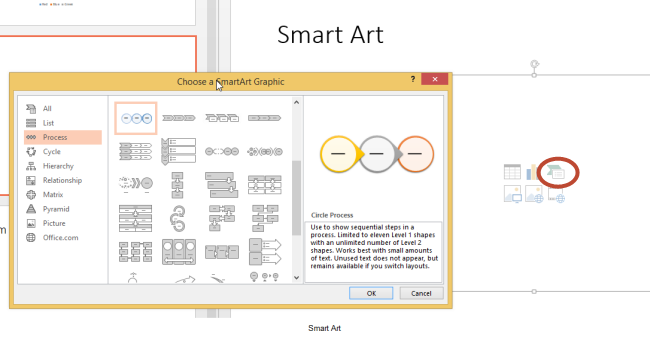
Add SmartArt
SmartArt is great in PowerPoint, illustrate your points in a visual way. There are SmartArt diagrams of all kinds. I have selected a process diagram here.
- Click on the Insert SmartArt icon
- Choose the type of SmartArt to add
Figure 47- add SmartArt
- Type into the SmartArt
We hope you found this article helpful and learned something new. If you would like to improve your knowledge on PowerPoint 2013, check out the “PowerPoint 2013” guide. Don’t forget to share it with your friends or colleagues if you think they could benefit from this article. You might also want to check out other PowerPoint blogs such as “How to present a PowerPoint presentation online”, “3 Simple Ways to Make a Creative Design in PowerPoint” or “How to format text in PowerPoint“
