Exclusive insights into flooding and moisture – An article by Peter Moir
My inspiration for writing “A Wet Look At Climate Change” (AWLACG), which can be downloaded for free on bookboon.com, came from looking around and seeing the world as a big ball of moisture.
When I was asked about a blog, I thought why not talk about what I do and tell you how I see things as we go through the year and the climate changes with the seasons or for other reasons. In this article, I would like to talk about the problem with water from all angles.
The reasons for flooding
I don’t think you will have missed the news about flooding in this part of Europe and that some people were unfortunate enough to be in certain repeatedly flooded areas.
Apart from stating the obvious that there’s been too much rain, you may have heard things like, “too much rain in the wrong place” or “too high a water table”. What is it about the “wrong place” or this mysterious “water table” that you can’t see?
A flooding example from my garden
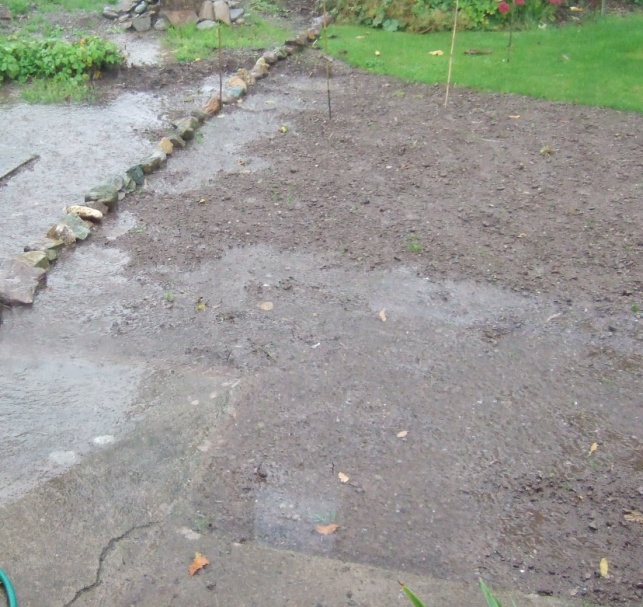 In this photo, you can see the surface water on top of soil that would normally drain through the soil and run off down the garden.
Clearly, too much rain “in the wrong place” or we should say “in one place” and the reason the water is not draining away is because months of wet weather have saturated the whole area and, simply, the water has nowhere to go very quickly.
Those of you that have read AWLACG will know that I take daily measurements of rainfall in my garden. The wet scene in the picture was a result of 35mm, nearly an inch and half of rain in one day.
Imagine this multiplied over large areas, hills and mountains, water running from higher to lower levels, all the while collecting in streams to rivers. If in the “wrong place”, torrents would be running down high streets!
The mysterious water table
But this is only the visible part of the story, what about this mysterious water table?
Part of my lawn has been soggy for the most of 2012 and through January of this year. By soggy, I mean like a wet sponge where you cannot see any water but press it and the water appears.
Walking on the lawn was spongy and mowing it had to be done very, very carefully to stop it carving up like underneath the scrums at the Six Nations rugby. Although we can’t see it, we have water sitting right under the surface. This is the “high water table”.
Any rain then quickly appears as surface water as the ground is already virtually full of water and there is no chance for drainage.
But why is the flooding worse than in the past?
To get to the other part of the story, I asked myself “why, when we’ve had heavy and persistent rain, have we so far not had such a bad problem with flooding?”
As well as measuring daily rainfall, I also record the daily high and low relative humidity along with the high and low temperatures. I believe the answer lays here.
If you read chapters 1 and 2 of AWLACG, I explain the relationship between temperature and humidity and how air can only hold a certain amount of water at a particular temperature.
I can see from my own records that the local climate has not allowed water to evaporate from the ground. For this to happen, the air immediately above the ground must be able to hold water vapour and by removing the water into the vastness of the sky, the ground dries out.
My own data says that the moisture in the air, which is shown by relative humidity, has remained so high that only small amounts of extra moisture from the ground are needed to saturate the air, at which point no more water can evaporate and be removed.
Weeks and months of this mean that the level of liquid water in the ground gets higher and higher until the water table is close to the surface, and for long periods of time sits on the surface as ponds and lakes.
Thinking about moisture this way is where the idea of having a “wet” look at climate change came about.
The case of the bee log
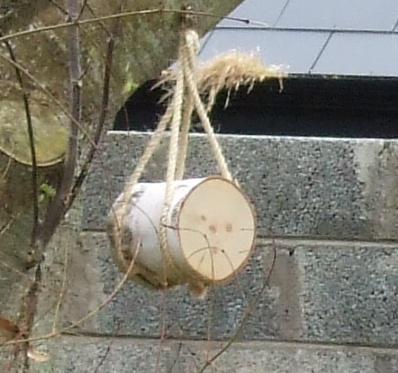 On a less destructive note, I want to introduce you to my bee log! Upon request, a bee log duly arrived wrapped in Christmas paper for the festive season 2011. This bee log turned out to have an interesting property: to watch the bees going in and out, I set up the log so I could see the holes.
Within a few days, the log had twisted round and the holes were facing away from me, which I thought might be connected with the wind.
After a while it twisted back round again and then twisted away again.
The two photos were taken within a few days of each other last spring and the log has been hanging there twisting away since.
Obsessed as I am with all things moisture, I checked my humidity readings compared to my twisting log and amazingly, the holes twist away from me when the humidity is high and back round when the humidity is lower.
Why did I do this comparison, you ask?
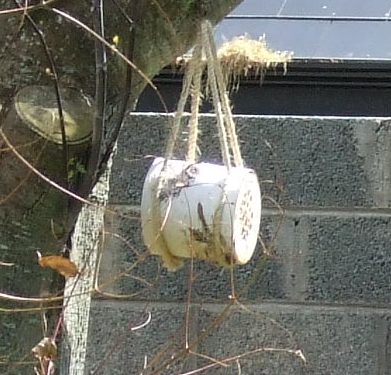 I wondered about the ropes attaching the log to the tree as rope is a natural fibre material and will interact with moisture in the air depending on its ERH (see Chapter 3 in AWLACG) and the %RH of the air.
The log is heavy and the tension on the individual ropes is affected by how long each rope is, and the amount of moisture in the rope could cause them to increase and decrease the length.
Because the four ropes are not exactly the same length or attached exactly symmetrically, this gives different torques pulling on the log, depending on the moisture level and causing it to twist.
My bee log is effectively a garden hygrometer.
Welcome to my world!
Visit our website www.relequa.com to see a video of moisture interaction and find out how we turned a natural property of materials into a powerful tool we call Moisture Profiling.
You can also download Moir’s free textbook “A Wet Look At Climate Change”.
“A Wet Look At Climate Change” – Free Download